

Rutgers University
Oyster Eco-Serve Calculator
v 1.0
Background
The Eco-Serve Calculator estimates the water quality benefits farmed oysters in the Mid-Atlantic provide to their local ecosystem. This calculator may be used by farmers interested in understanding the impact their farm has on local water quality. This calculator may also be used by members of the public who want to learn more about the ecosystem services oyster farms provide.
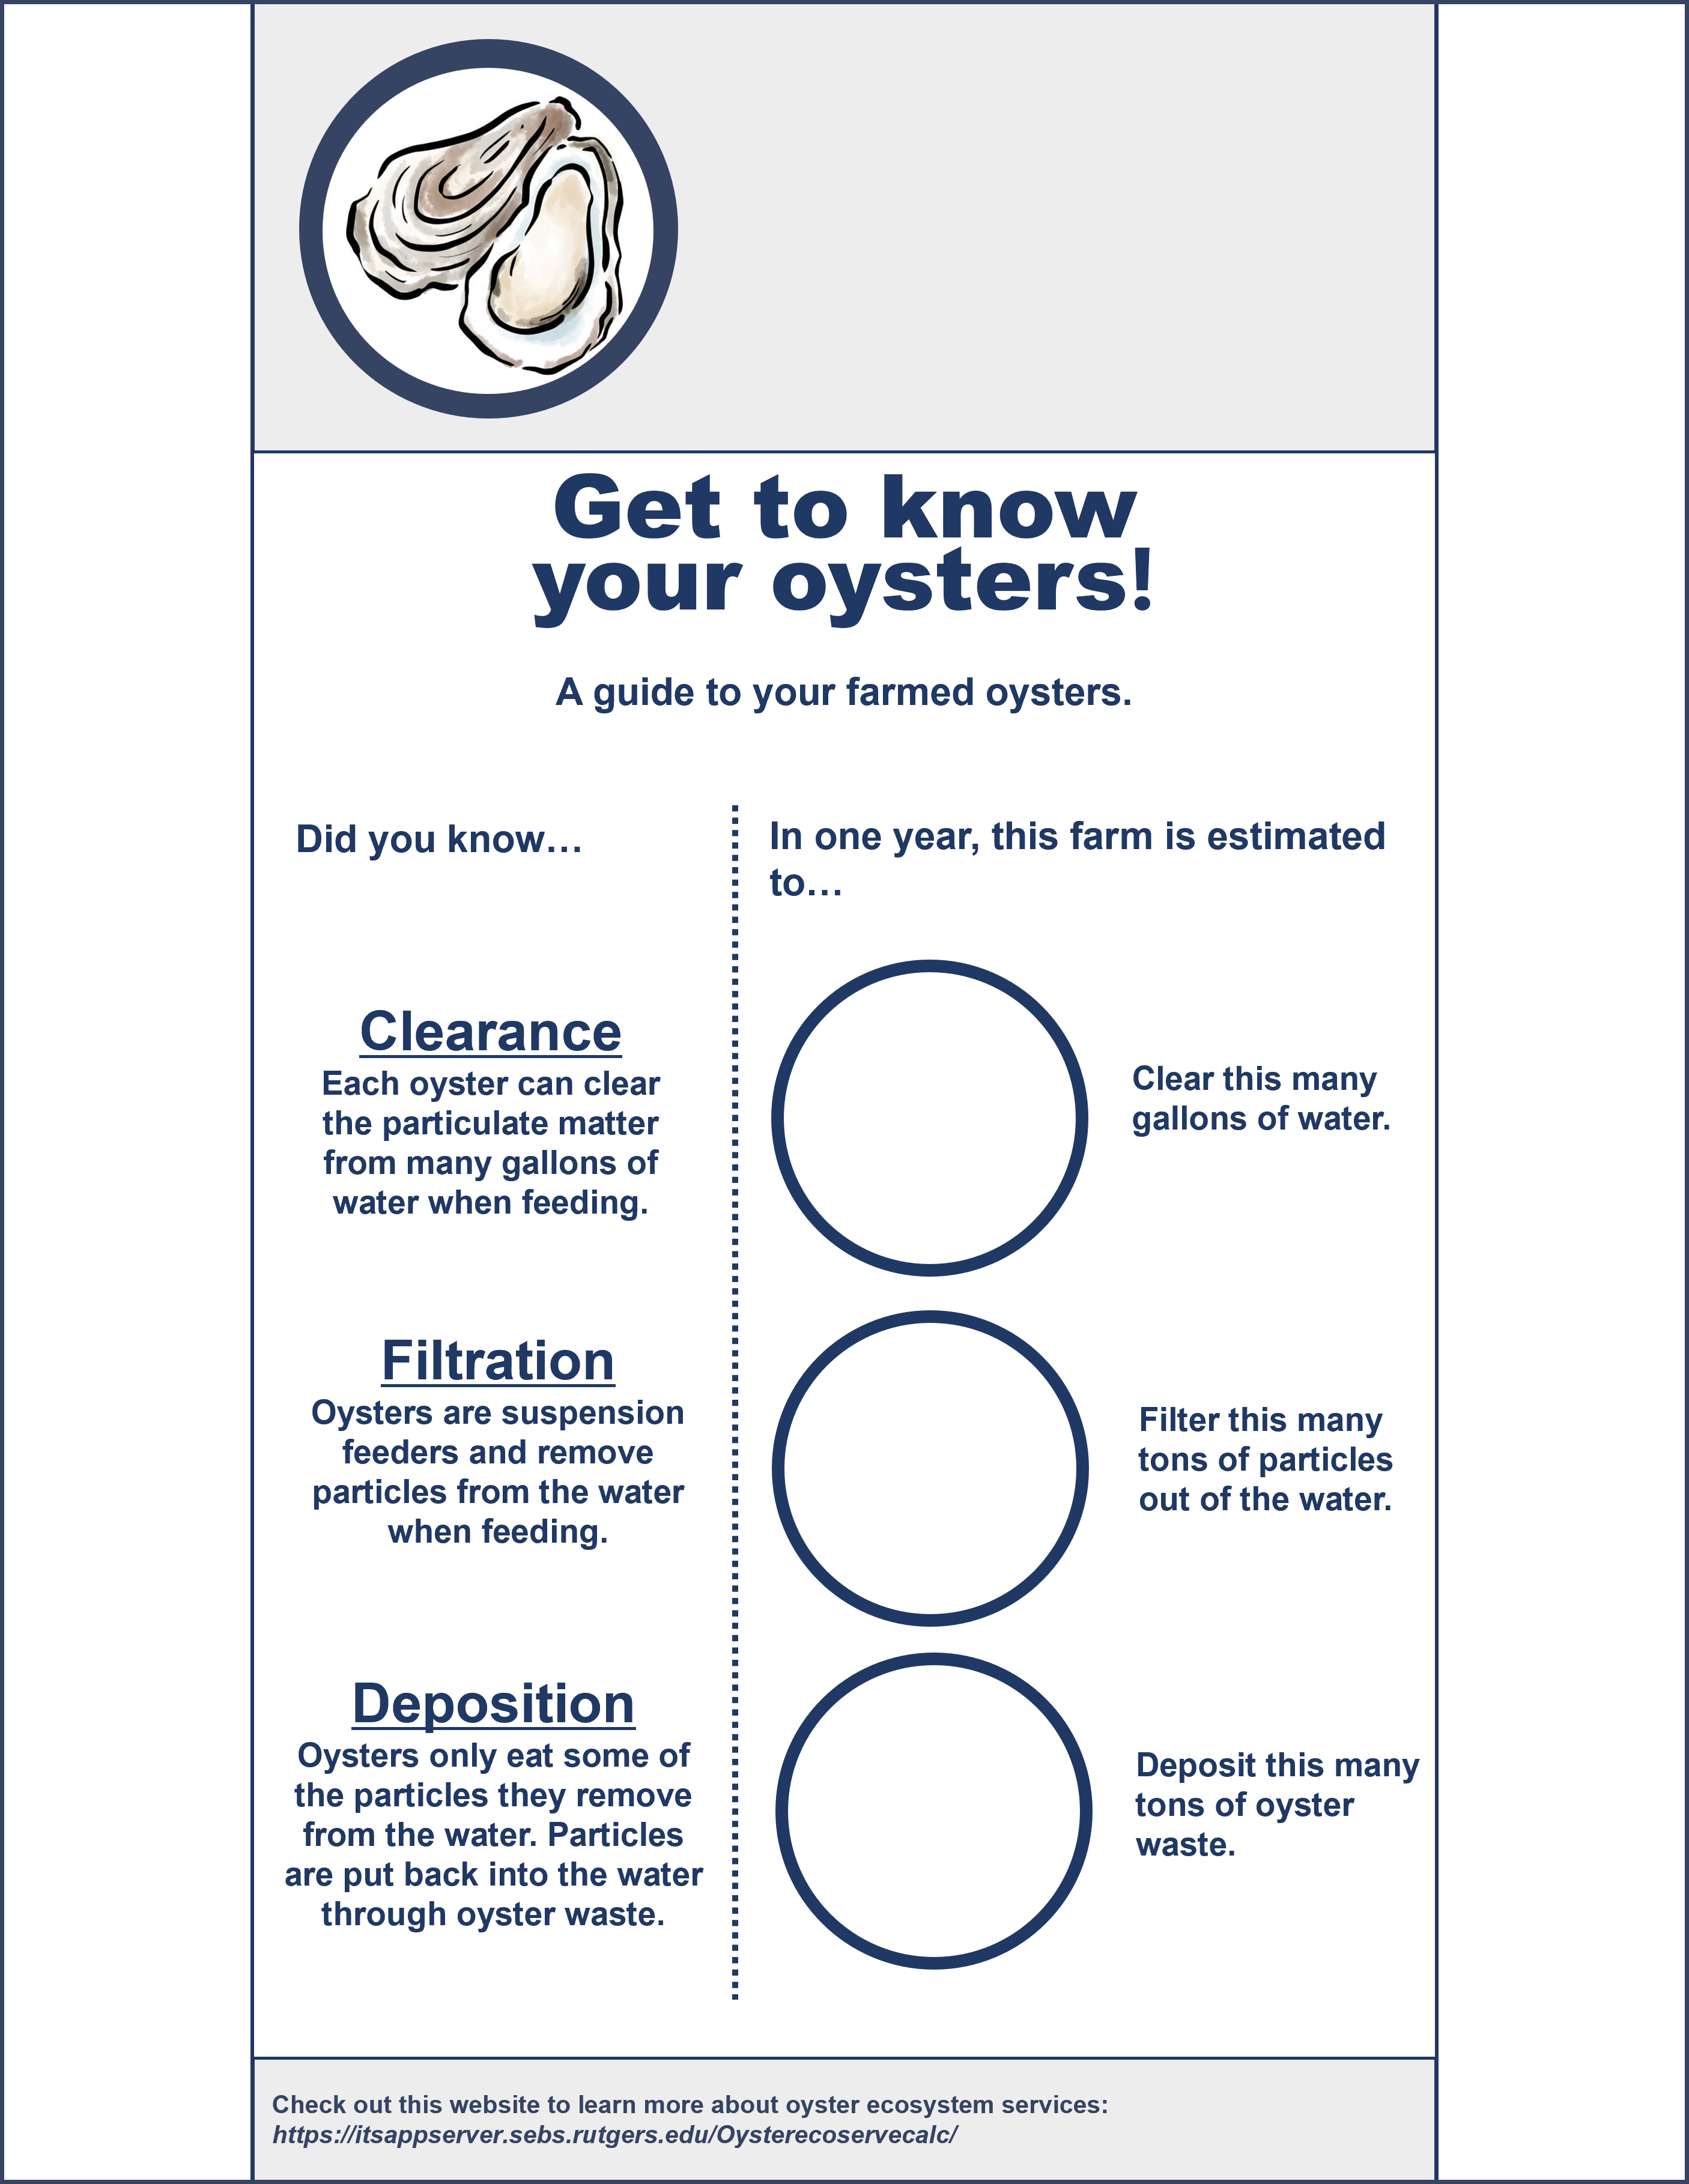
Oysters are suspension feeders that remove particulate matter from the water column as they feed. Oysters draw water across their gills where suspended food like algae and other small, nutrient rich particles are collected, transported to the mouth to be eaten, and then expelled as waste (i.e., feces and pseudofeces).
This calculator is based on experiments conducted seasonally between 2019 and 2021 at four oyster farms in the mid-Atlantic. During each experiment individual oysters were placed in a chamber with flowing water from the farm. All waste products produced by the oyster were collected and weighed to calculate precisely how much each oyster filters across the full calendar year. These experiments are unique because they provide a robust dataset of farmed oyster filtration observed under natural conditions.
The calculator below uses the experimental data along with the number of oysters on any intertidal or subtidal farm from Massachusetts to Virginia to provide a total farm estimate of filtration. For more information regarding the formulas used to create the calculator, please contact Michael Acquafredda at michael.acquafredda@rutgers.edu.
Calculator Inputs and Outputs
To use the calculator, please enter the following below:1. The estimated number of oysters on a farm. You may input your stock estimates into one of two tables, please complete the table to the best of your ability.
2. An estimate for the number of hours the farm is above water during low tide. If the farm is subtidal (i.e., always underwater), enter 0 hours.
3. Optional: Input the name of your farm and your farm's logo if you would like the calculator to generate a personalized infographic for your use. (Note that none of the information entered is stored in any way.)
The calculator will output the following estimates of annual, seasonal, and daily oyster filtration:
1. The volume of water the farm clears.
2. The total mass of particles the farm removes.
3. The total mass of particles the farm adds to the ecosystem through oysters waste.
The calculator will also output a personalized infographic that can be used at your discretion (for example on social media, a website, in print).
Let us know!
If you would like to be notified of updates to this calculator as well as trainings for its use, please join our e-mail list.
Have any questions or suggestions? Please share any questions or thoughts you may have to help us provide the best user experience and calculator outputs by emailing michael.acquafredda@rutgers.edu.
Additional Information
The research that generated some of the data for this calculator is summarized in this peer reviewed paper published in November 2023. This research was supported by funds from the USDA Northeastern Regional Aquaculture Center award number 93211-Z5111209, the New Jersey Water Resources Research Institute, the Rutgers Coastal Climate Risk and Resilience Program (NSF Grant No. 1633557), and the Rutgers Graduate Program in Oceanography.
This calculator was developed by Rutgers University's Haskin Shellfish Research Laboratory, with supplementary data provided by NOAA's Northeast Fisheries Science Center (Milford Laboratory), and in partnership with the Rutgers School of Environmental and Biological Science's Information Technology Services. This webpage was last updated March 2024.
If you would like a copy of our infographic that you can populate by hand, please download and print this PDF.
If you are having technical difficulties you can contact robert.muldowney@sebs.rutgers.edu.